Multiple Myeloma Data Set
Longitudinal, laboratory-rich histories, enriched with performance status and line of therapy derivations for more outcome-oriented evidence
Closing the gaps
Multiple myeloma presents a formidable challenge to real-world research. Its rarity alone makes cohorts sourced from just one or two institutions too small and potentially too biased for generalizable analysis. Fine-grained data that covers the entire natural history of the disease, from its insidious onset to branching treatment pathways, remains elusive. But the unmet need for better detection and treatment is urgent. The National Cancer Institute’s SEER program projects 35,730 new cases of multiple myeloma in 2023, continuing the trend of increasing incidence since the early 1990’s. Between 2012 and 2018, five-year relative survival rates across all SEER stages measured 58%, a prognosis more dire than colorectal cancer.
Closing these outcome gaps will require closing the data gaps. That’s why TriNetX has curated the largest EHR- and tumor registry-sourced set of de-identified multiple myeloma patient data ever available to researchers.
This is today’s data, with future refreshes, curated to answer pressing questions in trial design, natural history, real-world outcomes, and care disparities.
Data depth and breadth, from before, during, and after diagnosis

The multiple myeloma data set starts with a wide net and ends with highly granular observations for tens of thousands of de-identified patients. Its broad inclusion criteria—U.S. patients with at least one date-indexed diagnosis code for multiple myeloma—enable population-level analyses. Meanwhile, curated tables for patients who meet lab, medication, or other clinical requirements make this data set a research-ready ground for multivariate associations, risk modeling, and more.
Unlike patient registries, the data set reflects observations and treatments that precede the cancer diagnosis, as well as the full spectrum of concurrent non-hematological care, for a holistic view of each de-identified patient.
Observation-rich histories
Percentages are based on 101,906 patients with a first dx date since 1/1/2010.
%
with hypercalcemia, renal failure, or anemia observations
%
with observations 12 or more months prior to dx
%
with free light chain values
%
with M-protein results
%
with at least 2 years of post-dx monitoring labs and procedures
%
with treatment data spanning at least 12 months
%
with ISS staging at diagnosis
%
CAR-T eligible
A focus on recency
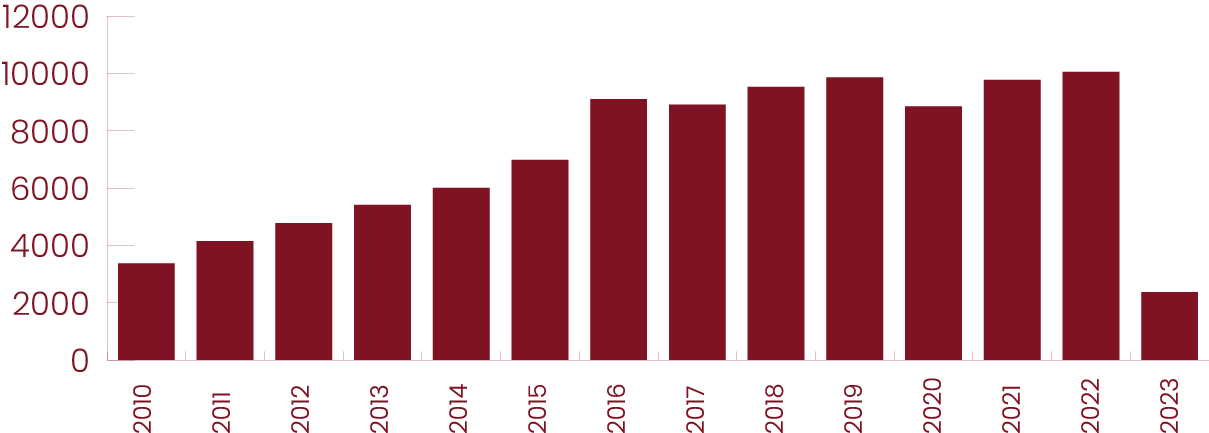
More than 50K patients were first diagnosed since 2018.
Patients by year of first diagnosis

The face of today’s patients
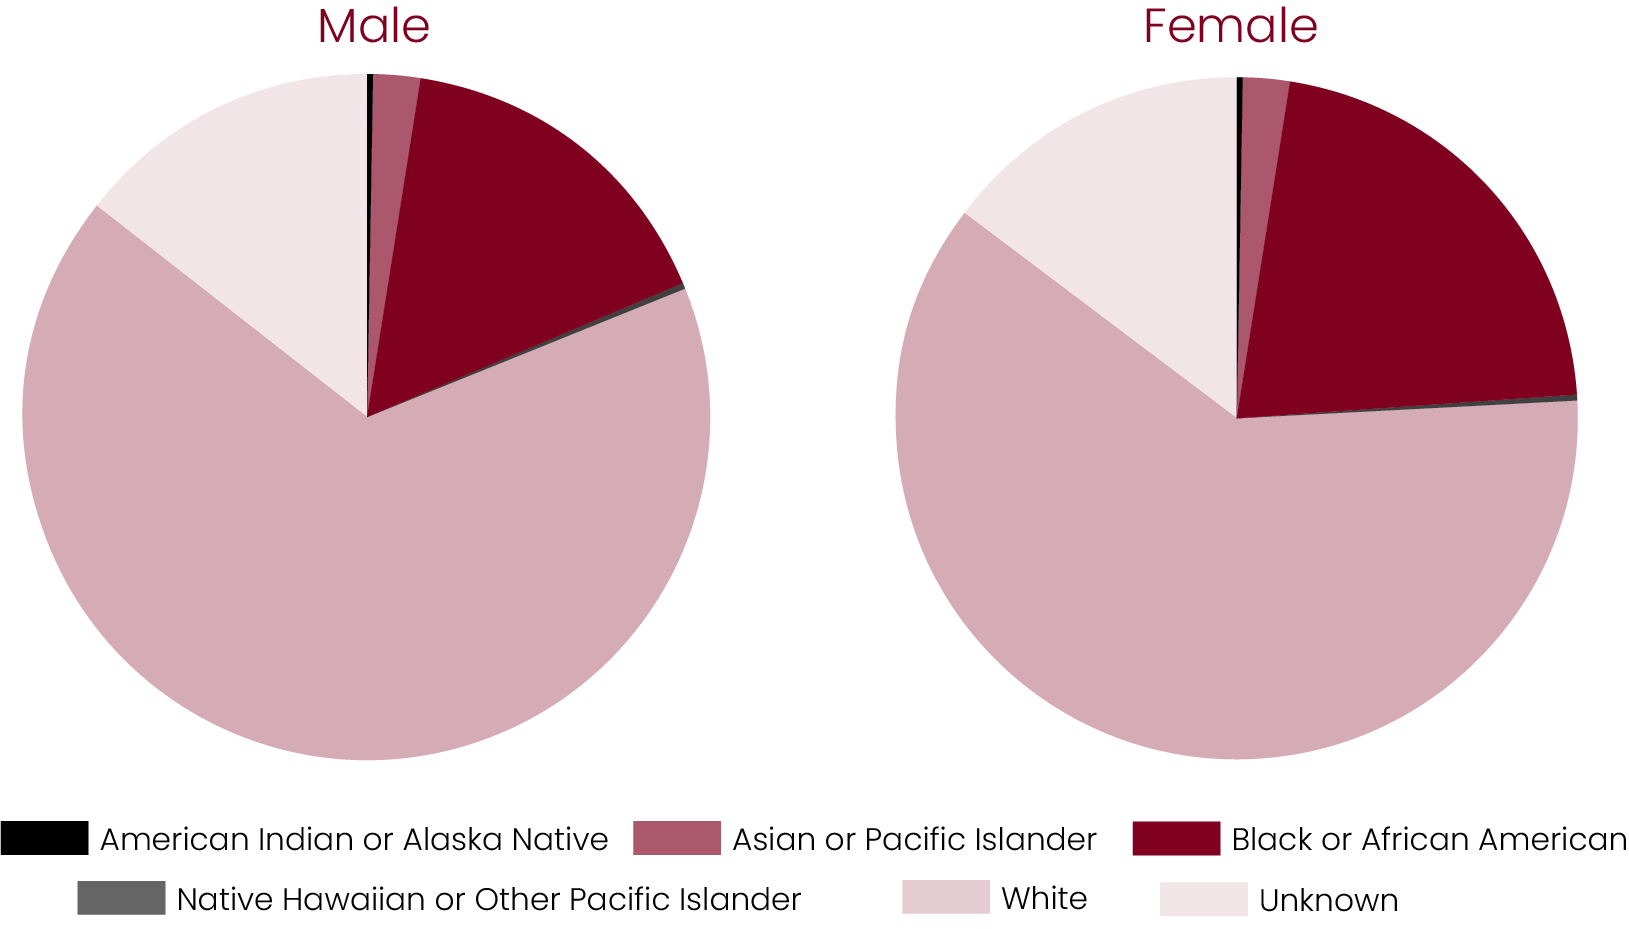
The data set includes 9,022 Black males and 9,781 Black females.
Male and female patients by race

Reliable inference from ground truth data
classes imputed (ECOG 0-4)
Multiclass ROC AUC
model features, based on literature review
precision score (PPV) on ECOG 0 or 1 vs 2, 3, or 4
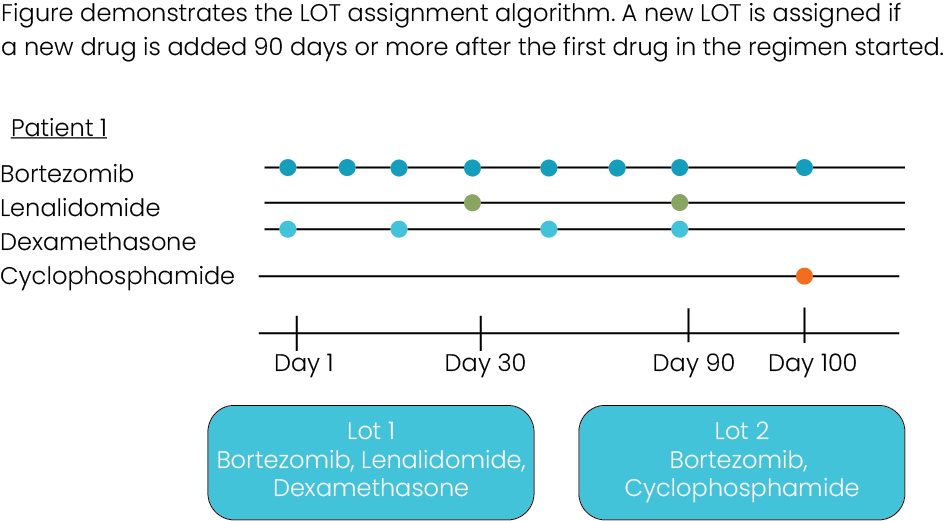
Time to, on, and between regimens, together with ECOG performance scores, represent two of the most robust markers of progression. Our data set includes hundreds of thousands of codes for chemotherapy administration, including agent and date, allowing any user to reconstruct a high-resolution treatment history based on the line progression criteria of their choice.
ECOG or Karnofsky scores from structured and unstructured data are provided for 4,799 patients. Most of these records include detailed observations whose association with performance status has been well-established. As a result, we’ve built and validated a machine learning model that imputes at least one score for an additional 29,983 patients.
Delivered your way, with a dictionary and user guide
Take possession of the data set in the environment of your choosing: ADX, Amazon S3, Snowflake, or any other platform. For expedited access in an analysis-ready platform, ask us to stage the data set in LUCID, our data science environment for coding and collaboration across your team.
We’ll also provide a comprehensive data dictionary and a user guide that explains our curation in detail.

Value across the research lifecycle
With coverage across domains as wide-ranging as demographics and laboratory assessments, the multiple myeloma data set offers value to researcher leaders in every stage of discovery.
Trial design
Evaluate eligibility, visit schedules, comparators, and endpoints against today’s patients and treatment patterns, to support faster enrolling studies that are more likely to avoid amendments.
Natural history
Analyze changes in M-protein levels, calcium, RBC counts, and more, along with the incidence of comorbities from hypertension to renal dysfunction.
Comparative safety & efficacy
Compare risks and survival curves between treatment cohorts (e.g., inter- and intra-class comparisons for monoclonal antibodies, proteasome inhibitors, and immunomodulating agents).
Care access & outcome disparities
Understand disparities in care and outcomes by race, age, and sex. Uncover the unmet needs of patients with various biomarkers (e.g., type of heavy and light chains).
Download the data table and curation guide for an in-depth look at all the elements.
"*" indicates required fields
